

How to Tell if Your Pond Has Low Oxygen Without a DO Meter
A dissolved oxygen meter is the best way to know exactly how much oxygen is in your pond. But most pond owners don't have one sitting in the garage.
Fortunately, a pond often gives you warning signs when oxygen levels are getting too low.
Fish behavior is usually the most obvious clue, but changes in algae, water color, weather and even the time of day can help you recognize a developing oxygen problem.
If you suspect low oxygen, the most important thing is to recognize the signs early. Once fish begin dying from severe oxygen depletion, there may be very little time to correct the problem.
1. Fish Are Gasping at the Surface
This is the classic sign of dangerously low dissolved oxygen.
Fish may swim just beneath the surface with their mouths opening and closing, appearing to gulp air. This behavior is sometimes called "piping."
Fish aren't actually breathing atmospheric air like we do. They're moving water across their gills in the part of the pond where oxygen conditions may be better.
A few fish occasionally feeding at the surface isn't necessarily a problem.
The warning sign is multiple fish remaining near the surface and repeatedly gulping or gasping, especially when this behavior is unusual for your pond.
If you see this happening around sunrise, take it seriously.
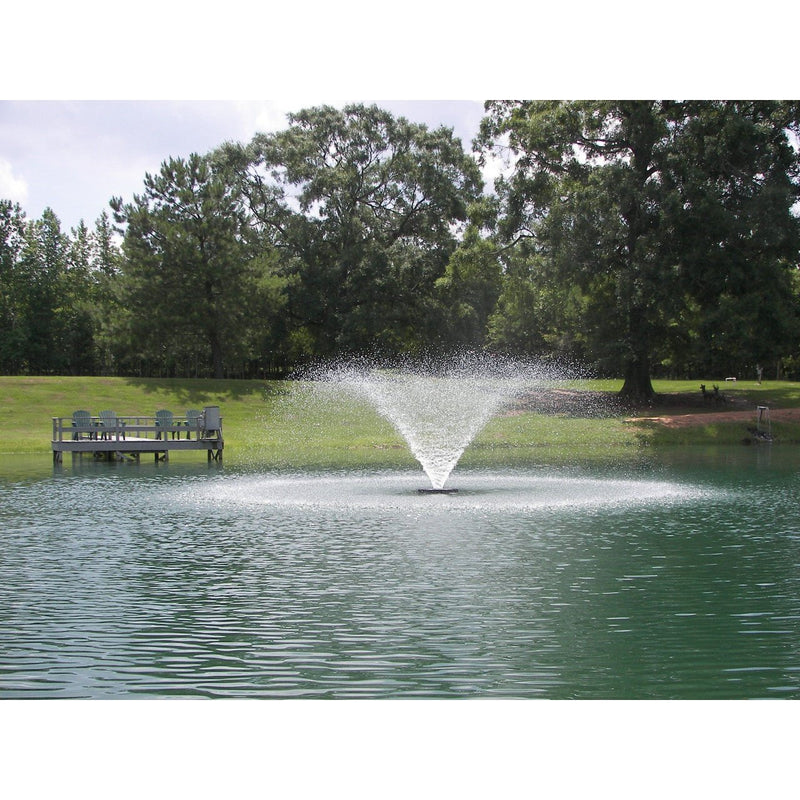
2. Fish Gather Around a Fountain, Aerator or Incoming Water
Fish have a remarkable ability to locate areas where conditions are more favorable.
When oxygen becomes scarce, you may see fish congregating around:
-
a fountain
-
surface aerator
-
aeration diffuser
-
waterfall
-
incoming creek or pipe
-
other areas where water is moving
Moving water generally provides better gas exchange and may create a small area with higher dissolved oxygen.
If fish that normally occupy the entire pond suddenly crowd around one of these areas, they're telling you something.
The more dramatic the change in their normal behavior, the more concerned you should be.
3. Larger Fish Show Stress First
One of the frustrating things about an oxygen-related fish kill is that it can take some of the largest and most desirable fish in a pond.
Large fish are often among the first visibly affected when oxygen becomes critically low.
You may notice large bass, bluegill, catfish or other fish near the surface while smaller fish still appear relatively normal.
If larger fish suddenly begin behaving strangely, don't assume the pond is fine simply because smaller fish aren't showing the same symptoms.
It may be an early warning that conditions are deteriorating.
4. The Pond Suddenly Changes Color
A sudden change in water color can be an important warning sign—especially during hot weather.
Imagine that your pond has had green water from a substantial planktonic algae bloom. Then over a short period of time the water changes from green to brown, gray or noticeably clearer.
That can indicate that a large portion of the algae population has died.
This creates two problems at once.
First, living algae produce oxygen during daylight through photosynthesis. When the algae die, that oxygen production decreases.
Second, bacteria begin decomposing the dead algae—and that decomposition consumes oxygen.
A major algae die-off can therefore cause dissolved oxygen to decline rapidly.
The combination of a sudden water-color change followed by fish gasping at the surface is a particularly strong indication that your pond may be experiencing an oxygen problem.
5. Fish Problems Are Worst Around Sunrise
If you're worried about low oxygen, one of the best times to look at your pond is early in the morning.
Here's why.
During daylight, algae and aquatic plants use sunlight to photosynthesize and produce oxygen.
After sunset, photosynthesis stops.
Fish, plants, algae, bacteria and other organisms continue respiring and consuming oxygen throughout the night.
That means dissolved oxygen commonly follows a daily cycle:
Afternoon: Higher oxygen
Overnight: Oxygen gradually declines
Just before or around sunrise: Lowest oxygen
After sunrise: Photosynthesis begins adding oxygen again
This is why a pond can appear perfectly normal at 5:00 in the afternoon but have fish struggling for oxygen at 5:00 the next morning.
If you only look at your pond during the middle of the day, you can miss the warning signs.
Conditions That Increase the Risk of Low Oxygen
Fish behavior tells you what's happening now, but pond conditions can tell you when to pay closer attention.
Low dissolved oxygen is more likely during certain situations.
Hot, Calm Weather
Warm water cannot hold as much dissolved oxygen as cooler water.
At the same time, warm temperatures increase biological activity and oxygen consumption.
Several hot, cloudy or calm days can therefore create conditions where oxygen production doesn't keep pace with demand.
Heavy Algae Blooms
A healthy amount of planktonic algae isn't necessarily bad. In fact, algae are an important part of a pond's food web and produce oxygen during daylight.
The risk comes from excessive blooms.
A dense bloom can create large daily swings in oxygen, and if that bloom suddenly dies, decomposition can create a substantial oxygen demand.
After Treating Large Amounts of Algae or Aquatic Weeds
Killing vegetation doesn't make it disappear.
The dead material must decompose.
If a large percentage of a pond's algae or vegetation is killed at one time, bacteria breaking down that material can consume substantial amounts of dissolved oxygen.
This is one reason pond treatments should be approached carefully during hot weather.
After a Sudden Weather Change
Strong winds, heavy rain or a rapid temperature change can sometimes disrupt a thermally stratified pond.
During summer, deeper water may contain very little oxygen. If that oxygen-poor bottom water suddenly mixes with the oxygenated surface water, dissolved oxygen throughout the pond can fall rapidly.
This is commonly referred to as pond turnover.
Lots of Organic Muck
Leaves, dead algae, aquatic vegetation, fish waste and other organic material eventually settle to the bottom.
Bacteria decompose this material, and aerobic decomposition requires oxygen.
A pond with a large organic load therefore has another source of oxygen demand working beneath the surface.
What About a Rotten-Egg Smell?
A strong rotten-egg odor can indicate the presence of hydrogen sulfide associated with anaerobic conditions in bottom sediments or oxygen-depleted water.
You may notice it when disturbing black organic muck or when deep water is suddenly brought to the surface.
The smell alone doesn't tell you the dissolved oxygen concentration of the entire pond.
But combined with heavy muck, stagnant conditions, dark bottom water or stressed fish, it's another indication that portions of the pond may have very poor oxygen conditions.
Can You Tell Exactly How Low the Oxygen Is Without a Meter?
No.
This is an important limitation.
You can recognize the symptoms of low dissolved oxygen without a meter, but you cannot reliably look at a pond and determine whether it contains 6 mg/L, 4 mg/L or 2 mg/L of oxygen.
Fish species also have different oxygen requirements, and water temperature affects both oxygen availability and fish metabolism.
That's why a dissolved oxygen meter is worthwhile for pond owners managing valuable fisheries, aquaculture ponds or ponds with a history of oxygen problems.
A meter turns an educated guess into an actual measurement.
But even without one, fish gasping at the surface—especially around sunrise—is enough reason to take action.
What Should You Do If Fish Are Gasping?
If multiple fish are gasping at the surface, don't wait until the next day to see what happens.
Start aerating the water as soon as possible.
If you already have an aeration system, make sure it is operating properly.
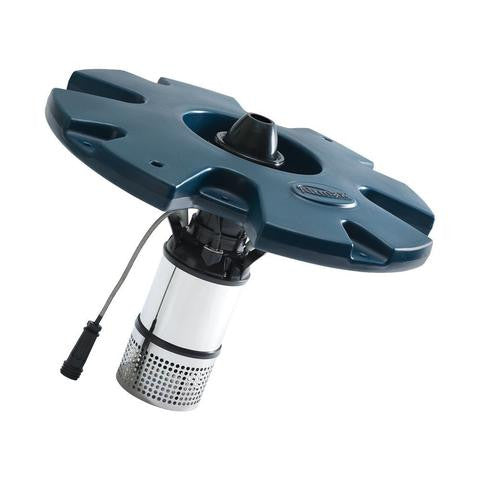
Surface aeration can be particularly useful during an oxygen emergency because it aggressively mixes air and water and can quickly create an oxygenated refuge for fish.
If no permanent aeration equipment is available, almost anything that aggressively splashes and circulates water at the surface can help during an emergency.
A pump can spray or cascade water back into the pond. In some situations, even an outboard motor positioned to aggressively churn surface water has been used as emergency aeration.
The immediate objective isn't necessarily to oxygenate every gallon of water in the pond.
It's to create enough oxygenated water to keep fish alive while conditions recover.
If you suspect that an algae or vegetation die-off caused the problem, remember that oxygen demand can continue while all that dead material decomposes. Aeration may need to continue beyond the point when fish first stop gasping.
What If You Already Have a Bottom-Diffused Aeration System?
A properly sized bottom-diffused system can greatly reduce the conditions that contribute to chronic low oxygen.
Diffused aeration works by releasing bubbles near the pond bottom. As those bubbles rise, they lift water toward the surface, where it can interact with the atmosphere.
The primary benefit isn't simply the oxygen contained in the bubbles.
It's the circulation created by the rising air.
Over time, this circulation helps reduce strong oxygen differences between surface and deeper water and keeps more of the pond's water exposed to atmospheric gas exchange.
But sizing matters.
A small aerator in a large or unusually shaped pond may create good conditions around one diffuser while leaving other portions of the pond poorly circulated.
Pond depth, surface area, shape and diffuser placement all affect how well an aeration system circulates the water.
Learn What "Normal" Looks Like in Your Pond
One of the most useful things a pond owner can do doesn't require any equipment at all.
Pay attention to your pond.
Notice where fish normally feed.
Watch the water color.
Know what a typical algae bloom looks like.
Observe how the pond responds to several days of hot weather.
Look at it occasionally around sunrise rather than always checking it in the afternoon.
Over time, you'll become much better at recognizing when something has changed.
And sudden changes are often your first warning.
The Bottom Line
You don't need a dissolved oxygen meter to recognize the most important warning signs of low oxygen.
Pay particular attention to:
Fish gasping at the surface, fish gathering around moving water, larger fish showing unusual stress, sudden changes in water color, and problems that are most noticeable around sunrise.
Also consider what has happened in the pond recently.
Has there been a major algae bloom? A sudden algae die-off? Several days of hot, cloudy weather? An aquatic vegetation treatment? A major storm or rapid temperature change?
One clue by itself may not prove that dissolved oxygen is low.
Several of these clues occurring together make the diagnosis much stronger.
And if fish are actively gasping at the surface, don't wait for proof.
Start aeration.
A dissolved oxygen meter can tell you exactly what's happening, but your fish may give you the warning first.